Cash Flow: 2015-16 FY Budget
This diagram depicts the flow of money through UA's budget: from revenue sources (on the left) to the various departments' expenses (on the right).
Mouse over a flow line to highlight it; click on a bar to highlight all its flows.
Fiscal Year
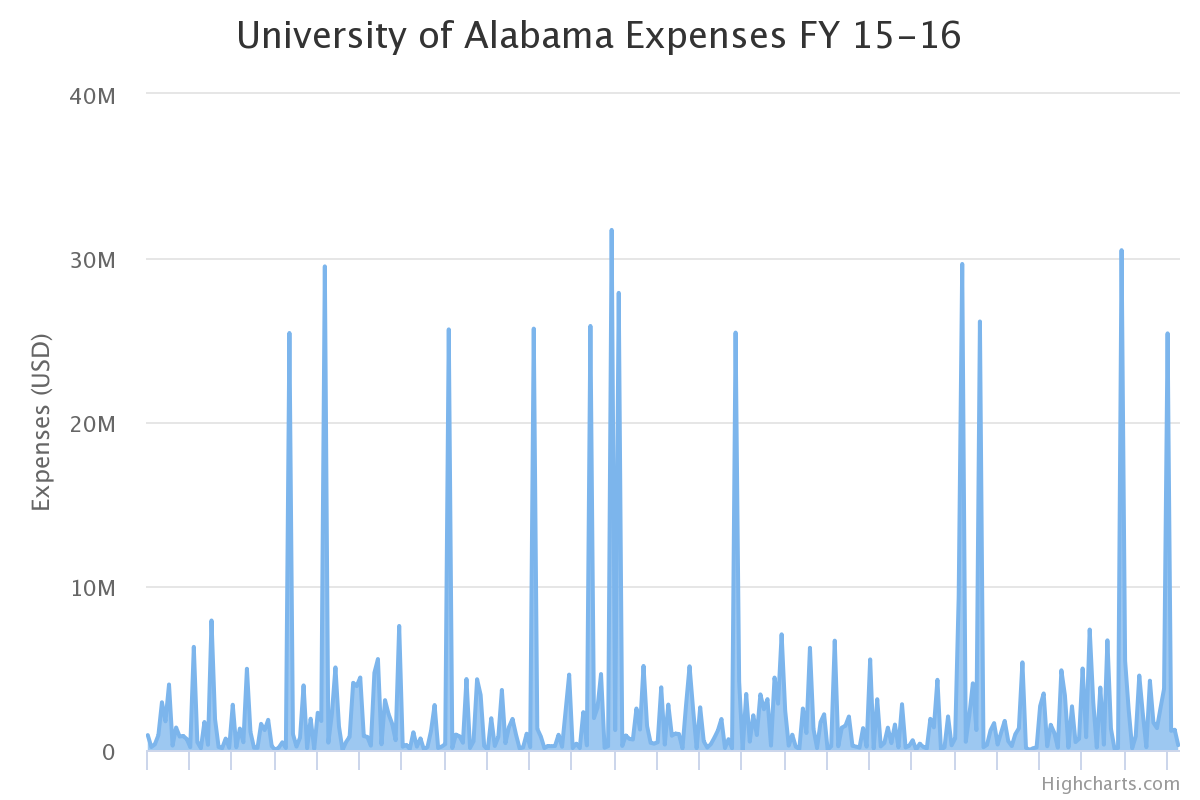
2015-16 FY Expenses as a Timeseries
This diagram shows the total expenses for each day in FY 2016.